QbD Dying Prematurely? Use This QbD Metric
 Boss: “I haven’t seen the results yet. There are 5 other high-priority programs. How can we justify your time training scientists on QbD? Can we even measure the success this year?”
QbD Manager: Its been only 6 months…I can see R&D scientists beginning to use DOE (Design of Experiments) and doing more risk assessments!
The Uncomfortable Conversation
I admit I ran into this conversation more than 3 times with 3 different organizations. In fact, it usually comes up within the first year of implementing QbD. Launching QbD is easier and more fun than trying to sustain the program. In the beginning, there is enthusiasm, curiosity and excitement over a new initiative. However after the novelty wears off and new fires and crises come up (which always happen), your management starts asking the question–”Where is my ROI?”– and rightly so.
When does this conversation come up? Usually at the beginning or at the end of a fiscal year when companies renew their annual goals, objectives and KPI’s. So, how do you tie your KPI and goals to QbD? For those who are leading QbD programs, this activity is challenging. Yes, ROI on these initiatives takes a long time. How nice would it be if we didn’t have to justify what we know will be beneficial? But do not despair. There is hope.
In fairness, as with most programs, QbD should be financially justified and be included in the annual goals and budgets of a company. Before delving into the approach, below were my personal requirements for an effective metric.
The metric:
-
has to be measure a progress
-
should add minimal work to generate, gather and update
Let’s break down the big question into smaller pieces. How do we define the success of a QbD program? How do we measure it? What are the intermediate milestones?
1. Define the Success of a QbD Program.
Some examples could be:
-
a full-QbD submission with regulatory relief in design space for a new drug: This would be an ultimate goal but will take multiple years.
-
Improvement in product performance and quality: This will also require multiple years to prove.
-
Increase understanding of the process: This is hard to quantify. We’ll need a surrogate measurement.
Let’s drill down into smaller goals that we can track.
2. How do we Measure the Progress of QbD?
This is the secret QbD metric inspired from the agile product development community. I have not seen anyone in our industry do this yet. For early R&D QbD projects, it is impossible to directly attribute QbD to revenue increase or cost savings. So instead, I use what I call a Risk Reduction Chart. Let me explain further. We do risk assessment already, correct? So we have baseline risk numbers for CQA’s or CPP’s. After the development team begins to perform experiments using DOE, these risk numbers usually go down over time. Risk management equates to success in development. Of course this means it is crucial to do the Risk Assessment correctly from the beginning. (Here’s how I approach it.) Here are the basic steps.
-
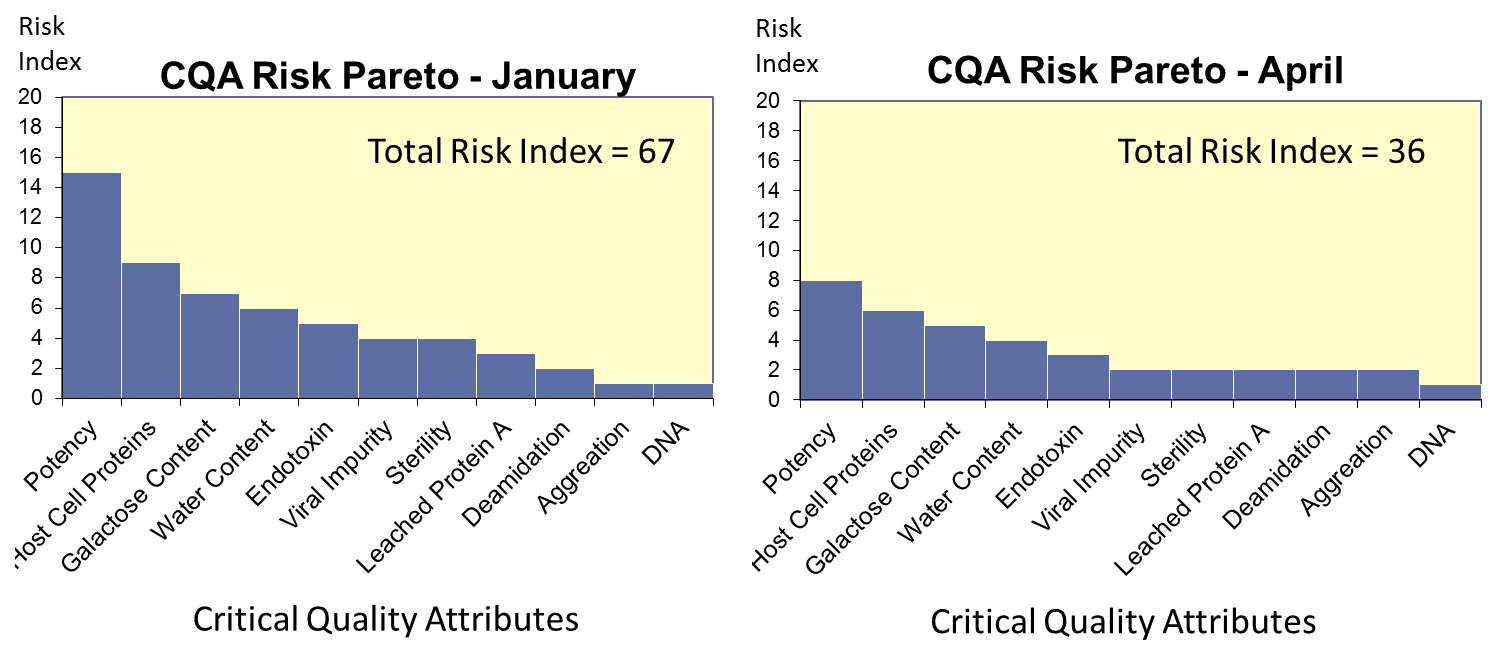
Generate a Pareto chart of Risk Indices (i.e. it on RPN) (URL template to Pareto Chart)
-
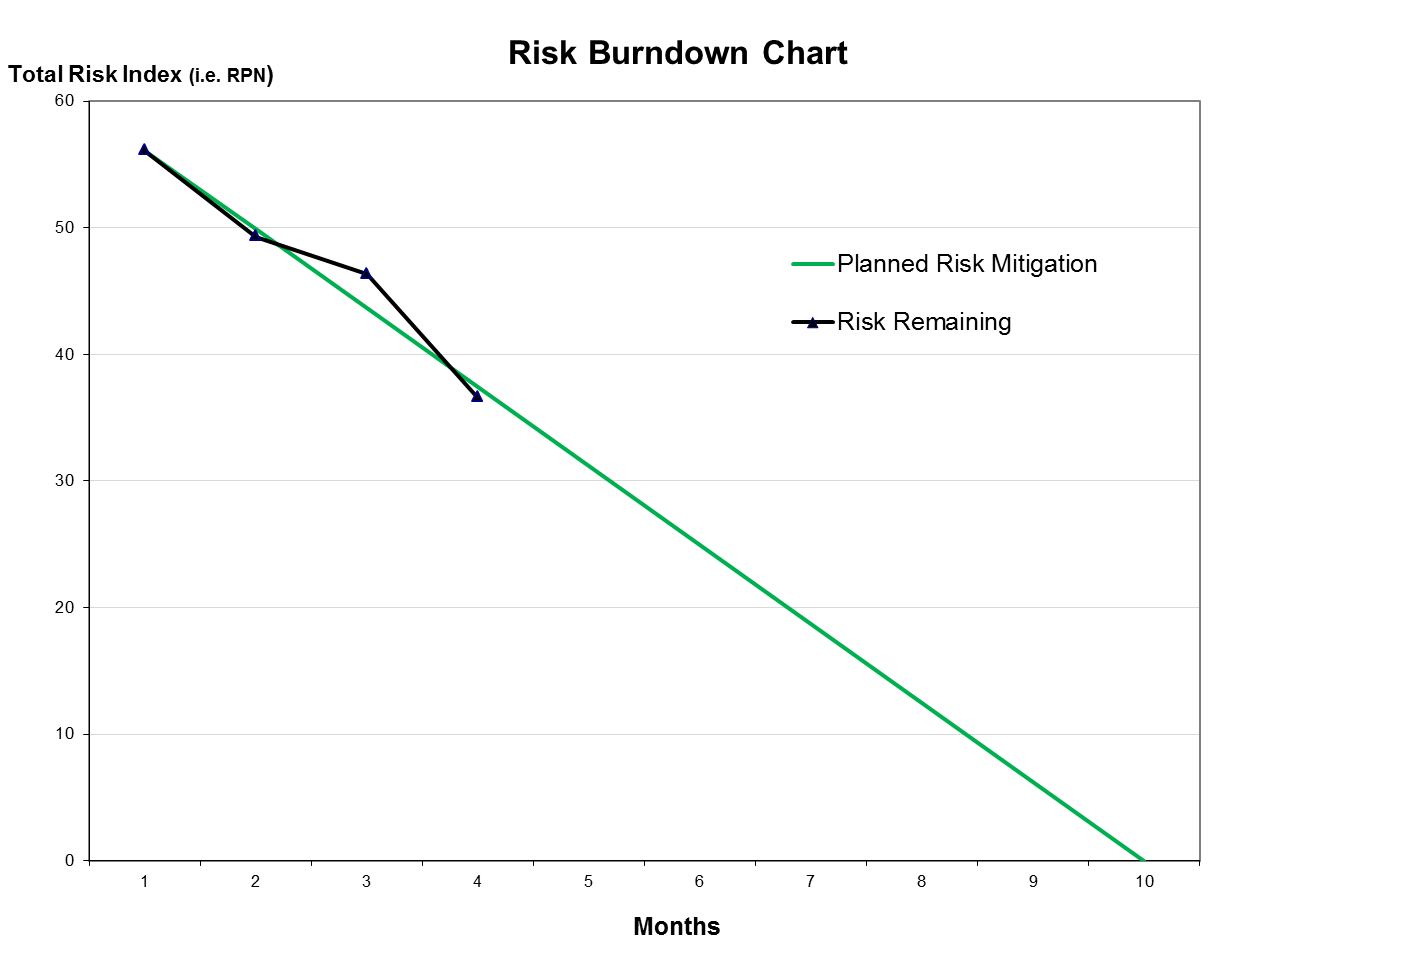
Plot it on a Risk Burndown Chart. (see figure below)
-
Track Risk numbers (i.e. risk index or risk priority numbers) for CQA’s or CPP’s.
-
Show the improvement by updating the risk numbers in a set frequency (i.e. quarter).
Below is a short example. Numbers are arbitrary for demonstration purpose. Let’s say the initial Risk Assessment resulted in a total or sum of 67 points. If your total risk index goes down to 36 in April by resolving impact, occurrence, or detection through experiments, your team has made significant improvements.
You can compare the progress of risk reduction for each CQA or CPP this way. If you want a higher level summary, you can plot the data as below. This may be a good KPI dashboard view for the management level. Since executives like to see a dashboard of KPI’s that indicate progress of a program or a project, the metric should synchronize to the frequency of the management review cycle.
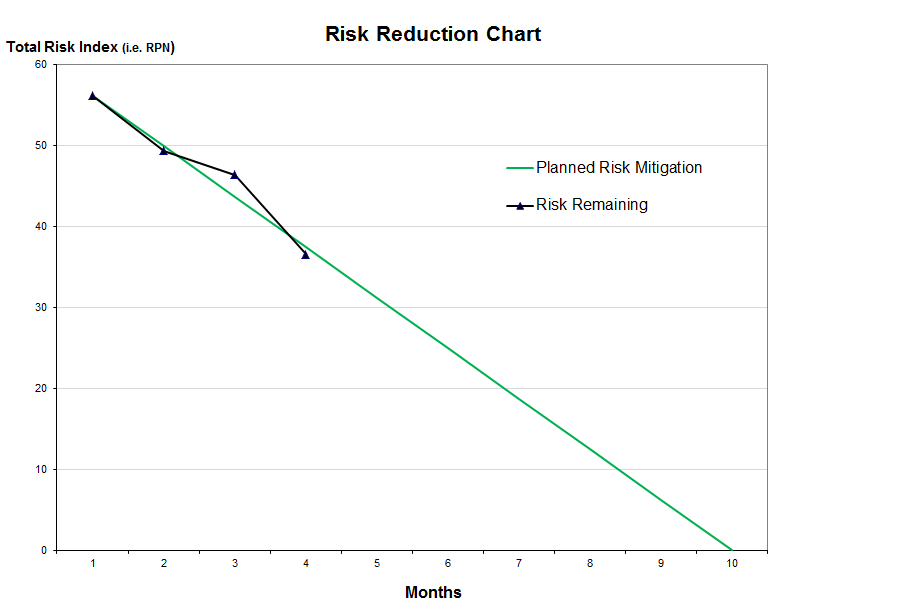
As you can see above, the green straight line outlines the plan. The black zigzag line depicts the progress of risk reduction of the development team. Now you can track the progress against the goal and timelines.
I agree that setting this system requires some effort and thought. So I am in the process of developing an easy-to-use, interactive Risk Assessment tool to help the facilitator be more effective and efficient with everyone’s time. If you want to hear updates on this project, feel free to subscribe on my newsletter.
So my question for you: How do you justify continuing a QbD program?