JMP Setup Guide for DOE – in 1 Minute
Now that we’ve covered: How to conduct QbD Risk Assessment in a smart way, I’d like to move onto the next step – QbD Design Space in a smart way.
Before we get into details, let’s set up our main tool –JMP– for success.
Surprisingly, many JMP users aren’t aware of this hidden function. I see many colleagues clicking excessively to display graphs they want to see and unclicking the unnecessary ones – resulting in wasted clicks every time.
Unfortunately, I couldn’t find a good guide on this.
Fortunately, this is a quick and easy cure. Just set up the software so that it only displays what you want – every time. Settings may be different based on the version of your software and personal preference. So I made a short JMP Setup Guide to share with you.
JMP Setup Guide
1. Setting up JMP Preferences
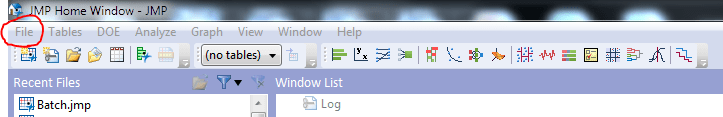
Click on “File”
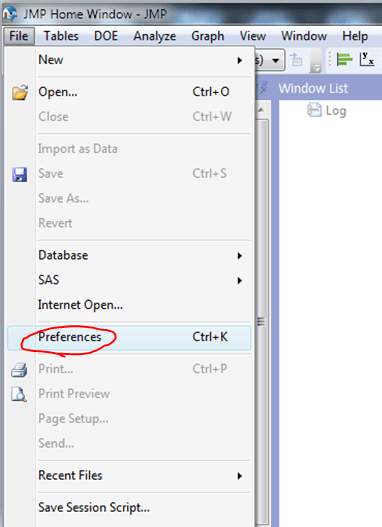
Click on “Preferences”
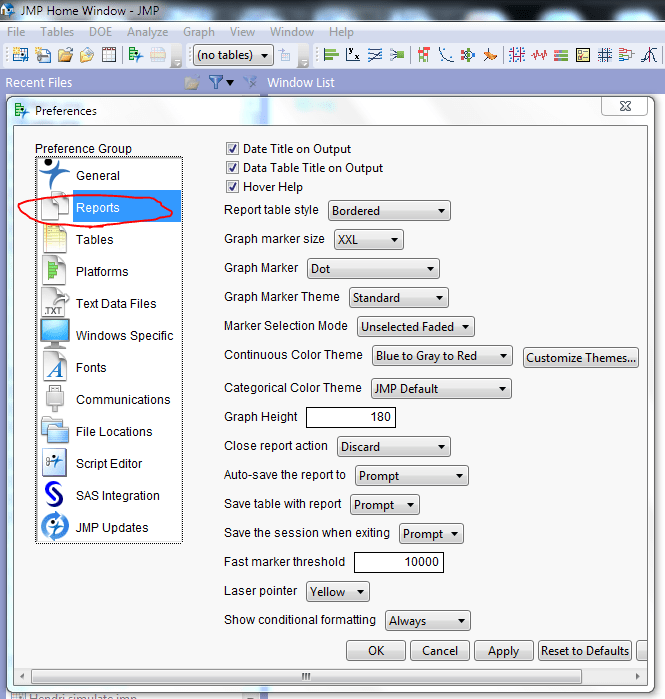
You will see a list of “Preference Group. Let’s first click “Reports”
2. Graph Format: Reports
“Reports” preference controls what your graphs will look like. Think of “Format” function for graphs in Excel – basically marker sizes, colors, shapes, lines and legends.
Match your settings to the one below. Your graphs will look better.
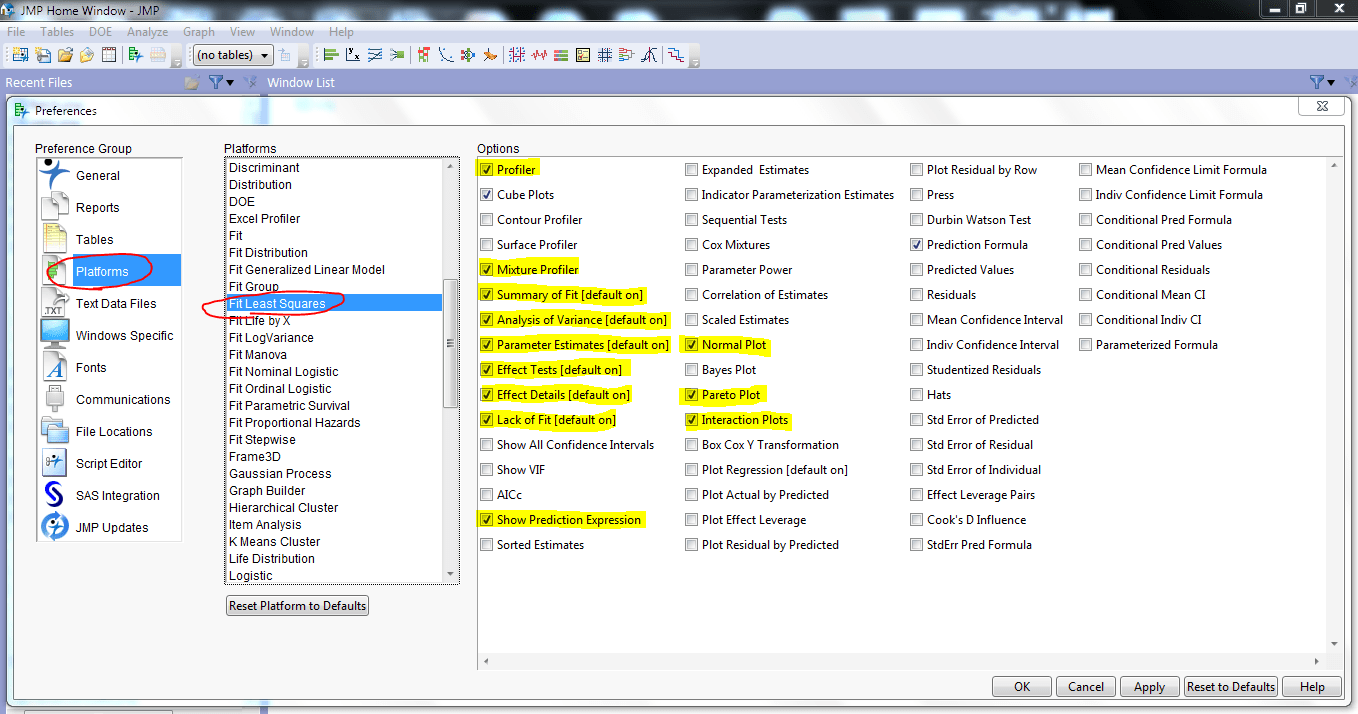
3. Graphs for Design of Experiments (DOE): Fit Least Squares
Next, “Platforms” is where you can dig into each function or module of JMP package. In our case, we are interested in the Design of Experiments module.
Click on the “Platforms” and then “Fit Least Squares.” Fit Least Squares is the algorithm that Design of Experiments analysis is based on.
Then check all the highlighted boxes and un-check the rest. Of course you can customize to your liking if you know what you need.
Click on the image below to Zoom.
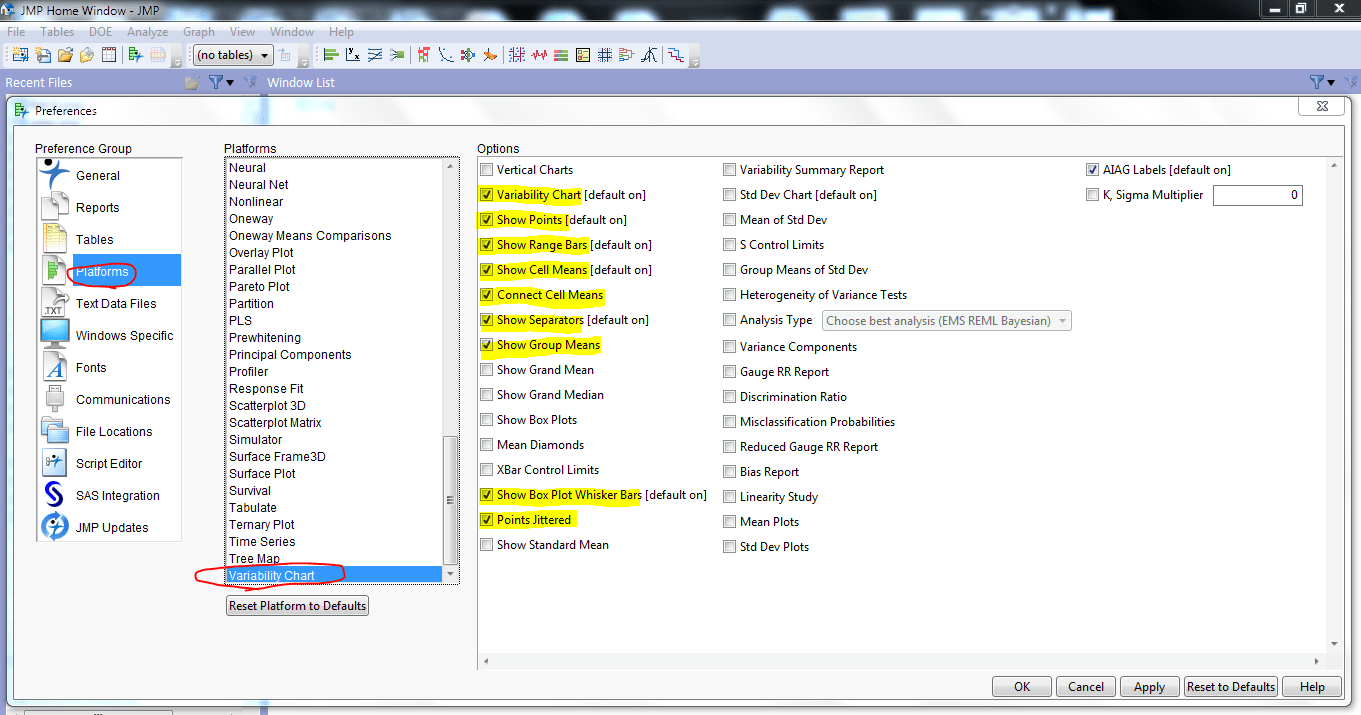
4. Graphs for Variation: Variability Charts
Finally, let’s set up Variability Charts – a JMP feature that I fell in love with (more on this later).
Click on the “Platforms” and then “Variability Chart.” Then check all the highlighted boxes and uncheck the rest.
That’s it for now. I hope this reduces your clicking and prevent RSI (Repetitive Stress Injury).
In terms of how to use these tools and analyses, we’ll cover in following posts. Sign up to receive them.
I’m excited to dive deeper into specific topics of QbD design space with you.
But first, I need your help. Tell me what topics you want to learn for your QbD projects.
Comment below (or Email me if you are shy) on the specific topics or questions that you’d like to get answers on.